WHIP is a well-known word in the culinary sphere, but did you know that it is also a baseball term? Yes, you read that right! WHIP is among the many technical jargon and lingo, like home runs and double play, within the world of this team sport. You will likely see this word on the box scores and hear it coming from live commentaries when watching a Major League baseball game.
So, What Does WHIP Mean in Baseball
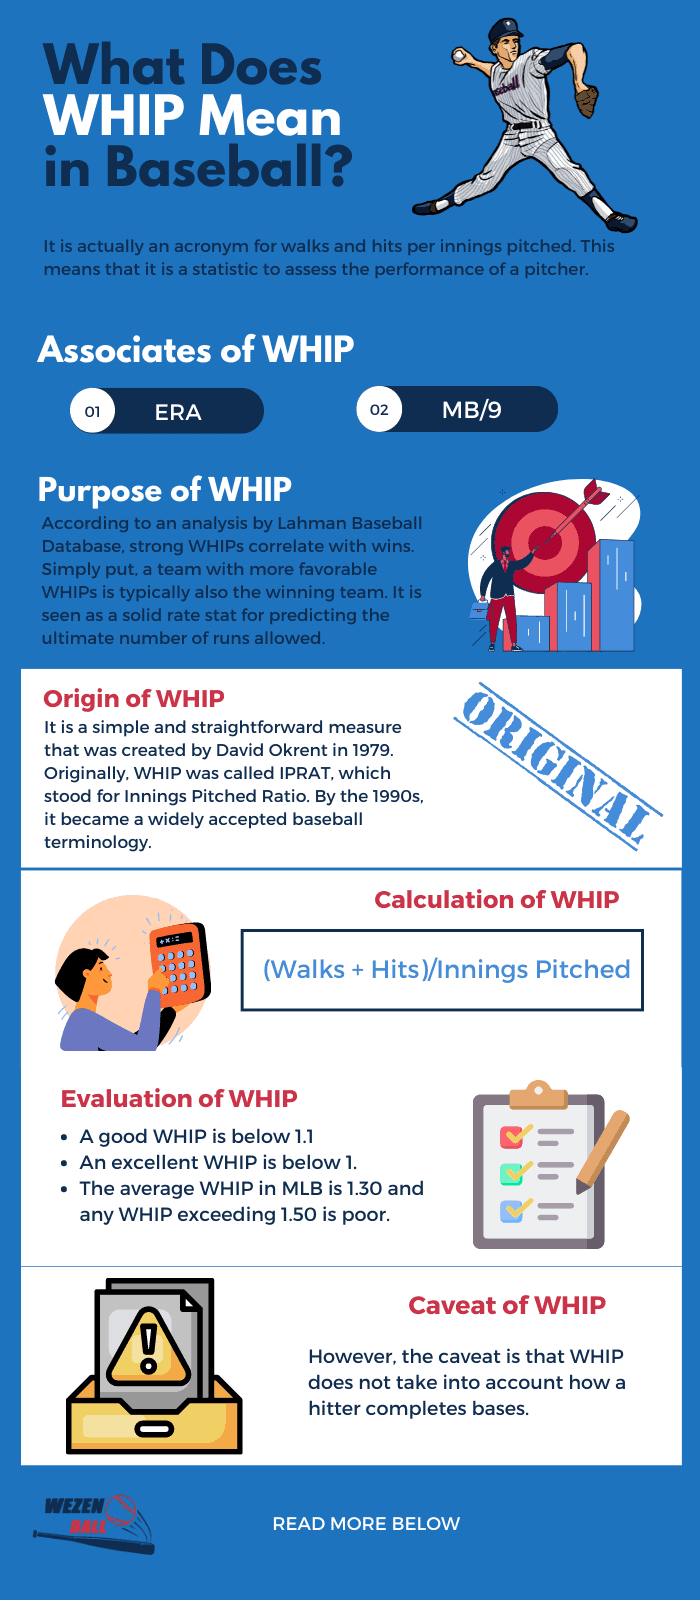
It is actually an acronym for walks and hits per innings pitched. This means that it is a statistic to assess the performance of a pitcher. In essence, it is the average number of baserunners that the pitcher “loses” to in an inning. Here, “loss” is determined when the baserunners score runs and reach base.
But, as with other baseball notions, there is a lot more to know about this four-letter acronym. To find out, continue reading!
Contents
What Does WHIP Mean in Baseball – Baseball WHIP Definition

As said earlier, WHIP is a stat that refers to walks and hits per innings pitched. Using WHIP, you can tell how well a pitcher is doing. Typically, you will see WHIP expressed in two or three decimal places. It is a very common measure that is worth knowing as a baseball fan or enthusiast.
1. Origin of WHIP
It is a simple and straightforward measure that was created by David Okrent in 1979. Originally, WHIP was called IPRAT, which stood for Innings Pitched Ratio. The statistic was used for scoring and making predictions in rotisserie fantasy baseball. By the 1990s, it became a widely accepted baseball terminology.
2. Calculation of WHIP
The formula for calculating WHIP is (Walks + Hits)/Innings Pitched. Basically, you add together the number of hits and walks allowed by a pitcher for a whole season, and divide it with the total number of innings pitched. So, the higher the value is, the worse the pitcher is deemed to be, and vice versa.
For example, if a pitcher allowed 50 hits and 20 walks within 50 innings, you will first add 50 and 20 to get 70, then divide by 50 to get a final WHIP value of 1.4.
3. Evaluation of WHIP
According to public consensus, a good WHIP is below 1.1—one run scored and one base. By this token, an excellent WHIP is below 1. It is important to note that WHIP is not as volatile as other stats in the baseball realm. In other words, the bar set for WHIP does not change year to year. The average WHIP in MLB is 1.30 and any WHIP exceeding 1.50 is poor.
Pitchers are supposed to prevent baserunners from scoring. Thus, it is generally the pitchers with a low WHIP stat that are the best.
4. Caveat of WHIP
However, the caveat is that WHIP does not take into account how a hitter completes bases. For example, it does not consider cases of hit-by-pitches, also referred to as hit batsmen. Hence, assuming that a pitcher hits at least one batter in a season, WHIP is not a 100% accurate measure. Errors and hitters who score through the fielder’s choice will also not be factored in. Nevertheless, it is equally arguable that this better reflects any pitcher’s performance.
5. Associates of WHIP
- ERA
WHIP is often judged along with another stat: ERA—earned run average. In most cases, it appears that pitchers with a good WHIP will also have a good ERA value. Like WHIP, the lower ERA a pitcher has, the better. Top-ranking pitchers often excel in both WHIP and ERA scores.
- MB/9
A very similar stat to WHIP is MB/9, which is short for Baserunners Per Nine Innings. If you are new to baseball, you may easily make mistakes between the two. However, there is a noticeable difference. MB/9 takes into consideration hit-by-pitches, while WHIP does not (As we have said earlier). But, compared to MB/9, WHIP is more commonly referred to.
6. Purpose of WHIP
A lot of fans pay attention to WHIP—for good reasons. According to an analysis by Lahman Baseball Database, strong WHIPs correlate with wins. Simply put, a team with more favorable WHIPs is typically also the winning team. It is seen as a solid rate stat for predicting the ultimate number of runs allowed.
Wall of Fame – WHIP Pitching Statistics
To give you a clearer idea, here are the top 20 pitchers on ranking for WHIP in respective years.
2021 Records
- Freddy Peralta – 0.87
- Brandon Woodruff – 0.88
- Max Scherzer – 0.89
- Walker Buehler – 0.90
- Kevin Gausman – 0.95
- Corbin Burnes – 0.97
- Clayton Kershaw – 0.98
- Joe Musgrove – 0.98
- Gerrit Cole – 0.99
- Trevor Bauer – 1.00
- Yu Darvish – 1.02
- Zack Wheeler – 1.02
- Anthony DeSclafani – 1.04
- Jose Berrios – 1.04
- Lance Lynn – 1.05
- Chris Bassitt – 1.06
- Julio Urias – 1.06
- Robbie Ray – 1.06
- Casey Mize – 1.11
- Marcus Stroman – 1.11
2020 Records
- Kenta Maeda – 0.75
- Trevor Bauer – 0.79
- Dinelson Lamet – 0.86
- Shane Bieber – 0.87
- Marco Gonzales – 0.95
- Jacob deGrom – 0.96
- Gerrit Cole – 0.96
- Yu Darvish – 0.96
- Brandon Woodruff – 0.99
- Kyle Hendricks – 1.00
- Dylan Bundy – 1.04
- Lucas Giolito – 1.04
- Adam Wainwright – 1.05
- Lance Lynn – 1.06
- Zach Davies – 1.07
- Aaron Nola – 1.08
- Dallas Keuchel – 1.09
- Zac Gallen – 1.11
- Framber Valdez – 1.12
- Zack Greinke – 1.13
More notable mentions for all-time totals! Below is a list of the top 20 players in terms of Major League baseball whip. All of the names below have a recorded stat lower than the league average.
- Addie Joss (Cleveland Indians) 0.97
- Ed Walsh (Chicago White Sox) 1.00
- Clayton Kershaw (Los Angeles Dodgers) 1.00
- John Ward (Providence Grace) 1.04
- Pedro Martinez (Philadelphia Phillies) 1.05
- Christy Mathewson (San Francisco Giants) 1.06
- Walter Johnson (Minnesota Twins) 1.06
- Mordecai Brown (Chicago Whales) 1.07
- Max Scherzer (Washington Nationals) 1.09
- Tommy Bond (Worcester Brown Stockings) 1.09
- Babe Adams (St. Louis Cardinals) 1.09
- Juan Marichal (San Francisco Giants) 1.10
- George Bradley (Troy Trojans) 1.10
- Rube Waddell (Louisville Colonels) 1.10
- Larry Corcoran (San Francisco Giants) 1.10
- Deacon Phillippe (Louisville Colonels) 1.11
- Sandy Koufax (Los Angeles Dodgers) 1.11
- Ed Morris (Columbus Colts) 1.11
- Will White (Detroit’s Wolverine) 1.11
- Chief Bender (Baltimore Terrapins) 1.11
Conclusion
So, with that, you have reached the end of this article on what does WHIP mean in baseball. Hopefully, you have picked up a lot of valuable information.
To recap, WHIP is among the many baseball statistics. It is a measure for walks and hits per innings pitched. It is one of the few indicators of a pitchers’ performance. When comparing, a lower WHIP is better than a high one.
Did you enjoy it? What did you find interesting? Please let us know in the comments. We are always super delighted to hear from our readers.
If you have any follow-up questions, do not be afraid to leave them in the comment as well. Also, feel free to share this article with your friends, family, and fellow baseball fanatics!

Five years as a baseball player, my training approaches with this game give me the motivation to inspire and support young players more. Like all sports, we should start with the desire to have fun and maintain our resilience to strive better at any competition. But, of course, some of us want to have some fun and train for better health. It does not matter what your initial purpose is; I believe that most people ever holding on to the baseball bat will fall in love with the games as I do.